It started, as most of my side projects do, with a spreadsheet getting out of hand. Since December 2024 I have been logging every kombucha batch: start date, tea blend, fermentation duration, bottling notes, taste rating. By batch 20 the sheet was doing its job, but it was not doing it with any elegance. I had to scroll, filter, and squint to answer a question as simple as "which tea combination tends to score highest?"
I had been using Claude Code at work for a few months, mostly for writing and refactoring. It occurred to me that this was a reasonable test case for something different: could I describe what I wanted, hand it a spreadsheet structure, and end up with a working HTML dashboard? With no JavaScript framework, no build pipeline, and no particular desire to spend a weekend fighting documentation.
The brief
I gave Claude a simple description of the spreadsheet layout and a rough list of what I wanted to see: total batches, average fermentation time, ratings over time, which tea blends I was using most, and a live view of whatever was currently brewing. I said I wanted it to load the Excel file directly in the browser, no server needed. Plain HTML, Chart.js for the graphs, Bootstrap for layout.
What I got back on the first pass was about 80% there. The card layout was solid, the charts rendered correctly, and the Excel parsing worked via the SheetJS library I had not actually heard of before Claude suggested it. The remaining 20% was the kind of iteration you would expect: tweaking how active batches were displayed, adding a second vessel column when I mentioned I brew in parallel, fixing a date parsing edge case. Around a dozen exchanges total.
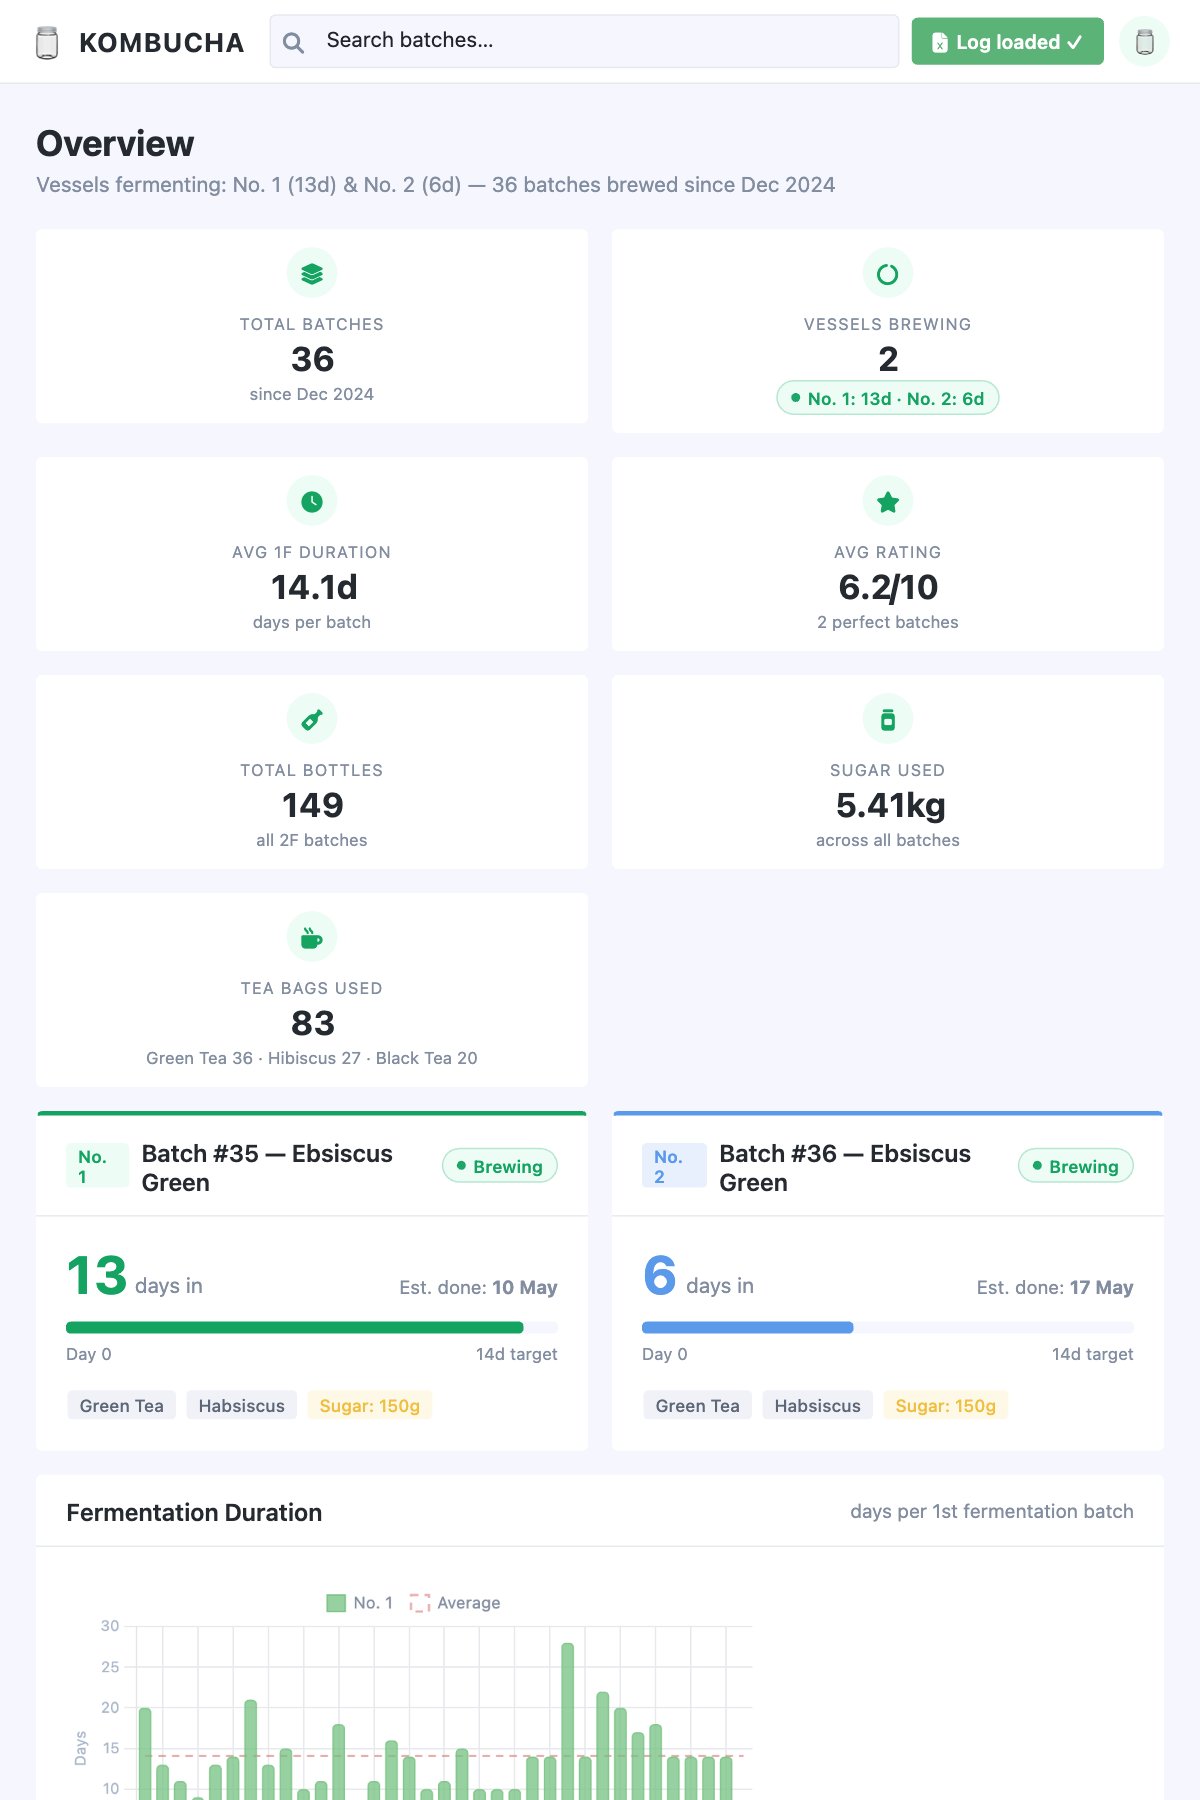
The overview panel as it looks today. Batch 35 and 36 both fermenting as I write this.
What it actually does
You drop the spreadsheet onto the page (or place it alongside the HTML file and it loads automatically) and the whole thing populates. At a glance: 36 batches since December, average first fermentation of 14.1 days, an average taste rating of 6.2 out of 10 across the second fermentations I have tracked. A live progress bar shows each active vessel and its estimated bottling date.
The chart I find most useful is ratings over time. My first five batches averaged 3.6. The last five averaged 7.0. Seeing that on a line chart is more motivating than any single tasting note in the spreadsheet. There is also a tea combination breakdown which confirmed what I had suspected: Black Tea plus Green Tea plus Hibiscus is my most-used blend by a considerable margin.

Ratings over time (middle chart) tells the most useful story. The trend is clearly upward.
What this says about AI-assisted development
I want to be precise about what Claude did and did not do here. It did not read my mind. Every feature that exists in the dashboard exists because I described it clearly. The quality of the output was directly proportional to the quality of the brief, which is exactly what you would expect from any development conversation, human or otherwise.
What it changed was the cost of entry. I did not need to spend two hours reading SheetJS documentation. I did not need to figure out Chart.js tooltip configuration from scratch. The scaffolding appeared, I directed the detail, and the thing got built in an evening. For someone whose day job involves describing requirements to technical teams, the workflow felt surprisingly familiar.
The gap that AI closes is not between having an idea and having skills. It is between having an idea and having time.
The dashboard will not win any awards. But it answers the questions I actually have about my brews, it runs entirely in the browser, and it took one evening rather than one weekend. Batch 35 is 13 days into first fermentation and due to bottle tomorrow. The dashboard told me that before I even walked to the kitchen.